Automatic productivity visibility—without manual reporting.
Install it, let it run, and transform all activity captured on the devices where ClowdWork is installed into clear productivity insights for on-site, hybrid and remote teams.
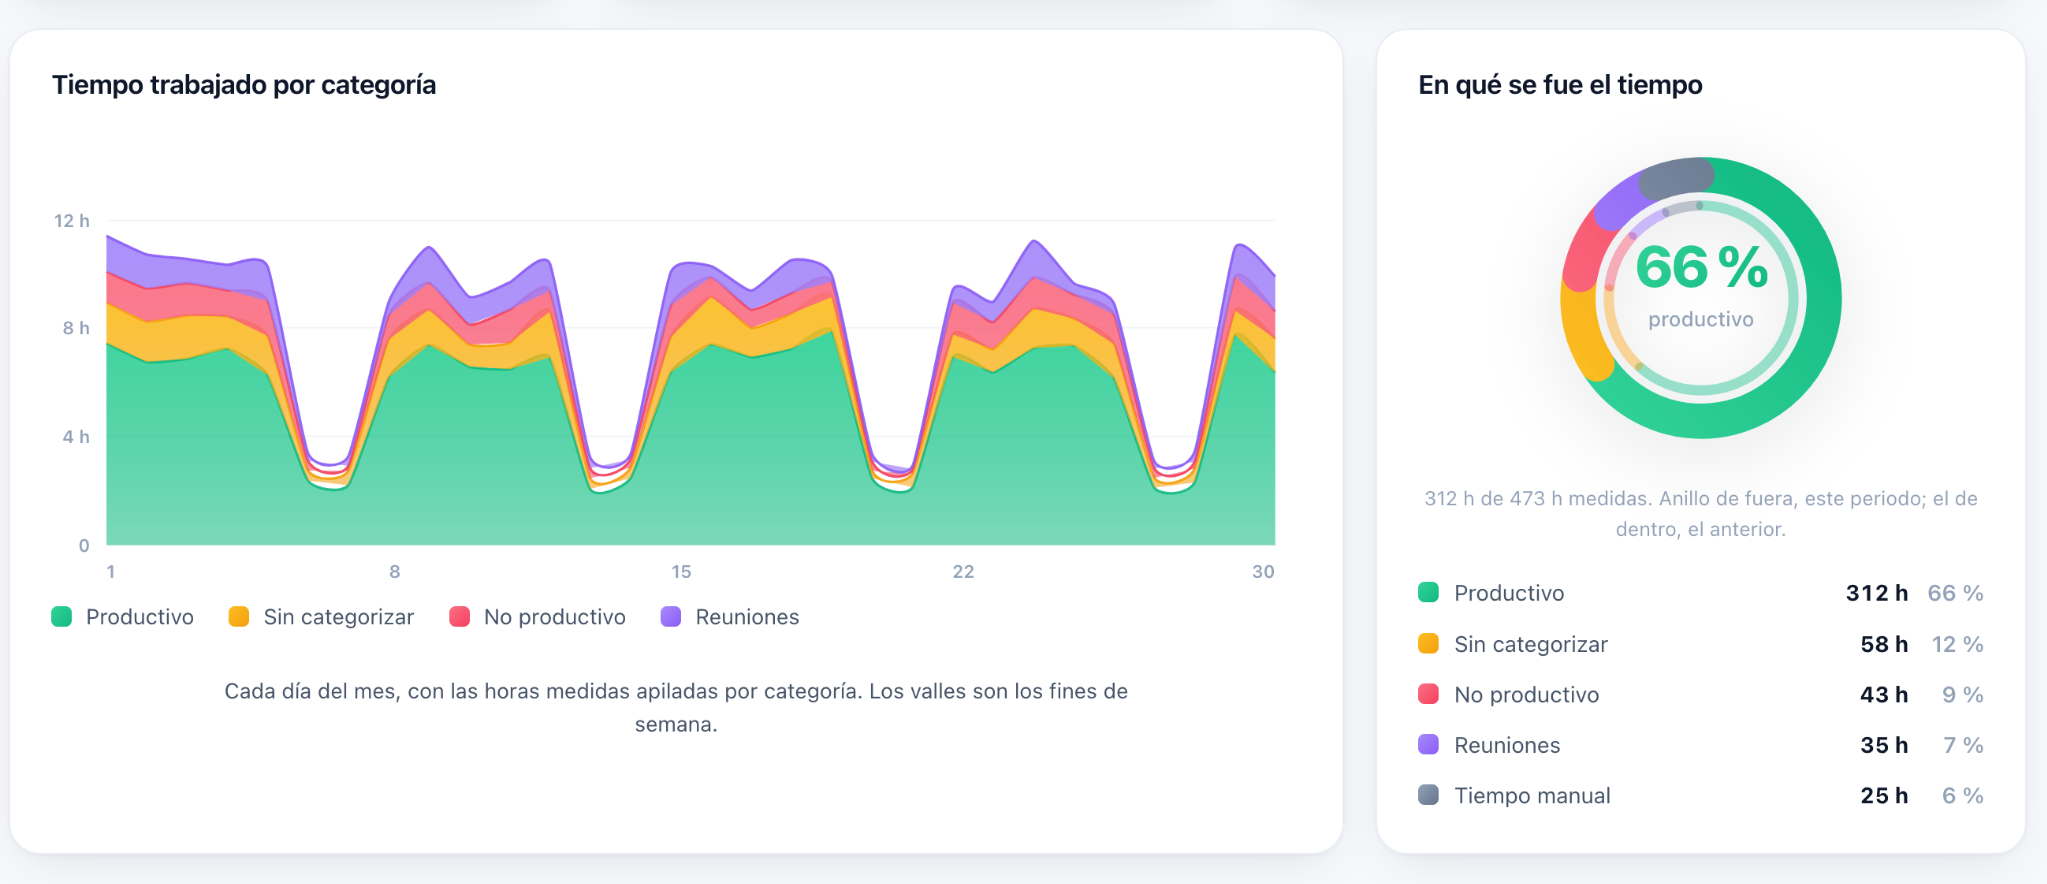
The workday, the load and the trend.
Workday visibility
Start and end times, productive and unproductive time, idle periods and how each workday is structured.
Workload distribution
How work is distributed across the team, and which overloads or imbalances show up.
Comparative performance
Comparison by person, team or area through structured reports.
Trends over time
How productivity evolves for each person, each area or the whole organization.
From activity to productivity insights. Automatically.
- 1InstallClowdWork is installed on devices authorized by the organization.
- 2Capture automaticallyThe agent continuously captures work activity in the background.
- 3Process and understandClowdWork organizes and analyzes that activity according to each role and the organization’s productivity criteria.
- 4Turn activity into productivity insightsThe platform shows where time is being spent, how focused teams are on productive activities, workload patterns and how productivity evolves over time.
Installed once. Runs automatically in the background.
Nobody has to open anything, start a timer, or remember to stop it at the end of the day. That is the difference between measuring and asking people to report.
What it records
- Which application is in front, and for how long.
- Whether there was keyboard and mouse interaction in each interval.
- Time entered by hand, when the organization allows it.
- Screenshots, only if they are enabled for that person.
What it does not record
- What is typed: it counts keystrokes, not which keys.
- The content of emails, messages or documents.
- Nothing beyond the counters when screenshots are off.
- A score for the person. Classification labels time; it does not judge.
Privacy and control you can trust
The organization authorizes the installation. Once installed, the platform continuously captures activity on the device to generate insights.
Measure productivity where the use of working time is a meaningful indicator.
ClowdWork Productivity is especially useful for roles where work happens mainly on the computer and where productivity can be understood through how working time is used.
It is particularly well suited to administrative, operational, finance, accounting, back-office and customer service teams, where recurring digital tasks are part of the day-to-day work.
In these environments, ClowdWork helps organizations understand how working time is being used, how much of it is focused on productive activity and how productivity evolves over time.
See how working time is distributed throughout the day.
ClowdWork helps organizations understand how each workday is distributed across productive activity, non-productive time, idle periods and other types of recorded activity.
This visibility makes it easier to identify where time is being lost, how focused people are during the day and what actions can help increase time spent on productive work.
Workday distribution is shown automatically, without employees having to report their time manually.
Example split. Yours will depend on how your applications are classified.
Follow how work evolves throughout the day.
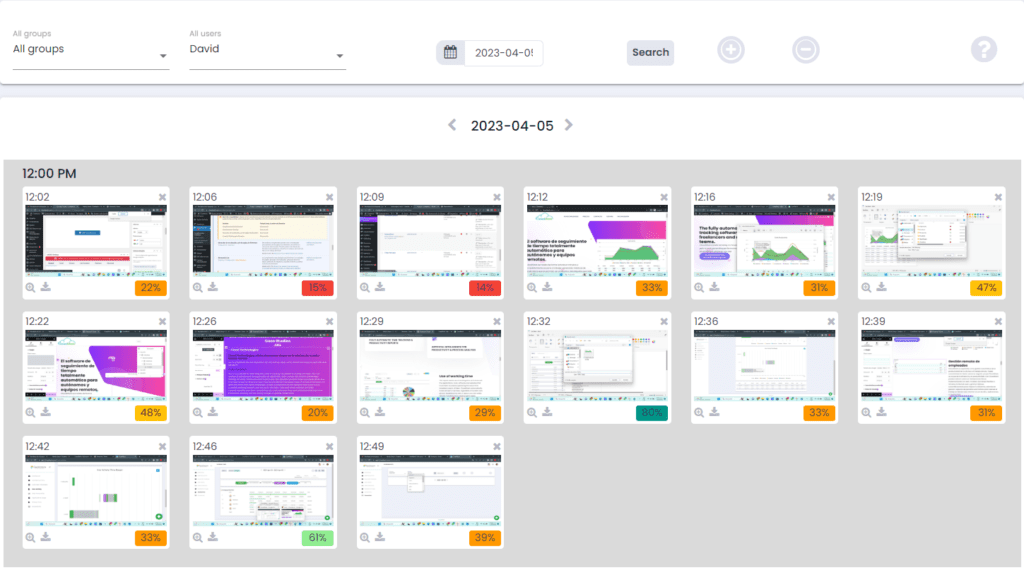
When enabled, ClowdWork can take screenshots at regular intervals to provide a visual timeline of how work progresses over time.
- This gives organizations an additional layer of validation when they need to review activity in more detail, complementing the productivity data already captured automatically by the platform.
- By default, screenshots are taken every five minutes and displayed chronologically, making it easier to understand the sequence and evolution of work during the day.
- Screenshots are optional and can be enabled or disabled according to the organization’s needs.
This is what a customer sees today.
No mockups, no recreations: these are ClowdWork Productivity screens in operation.
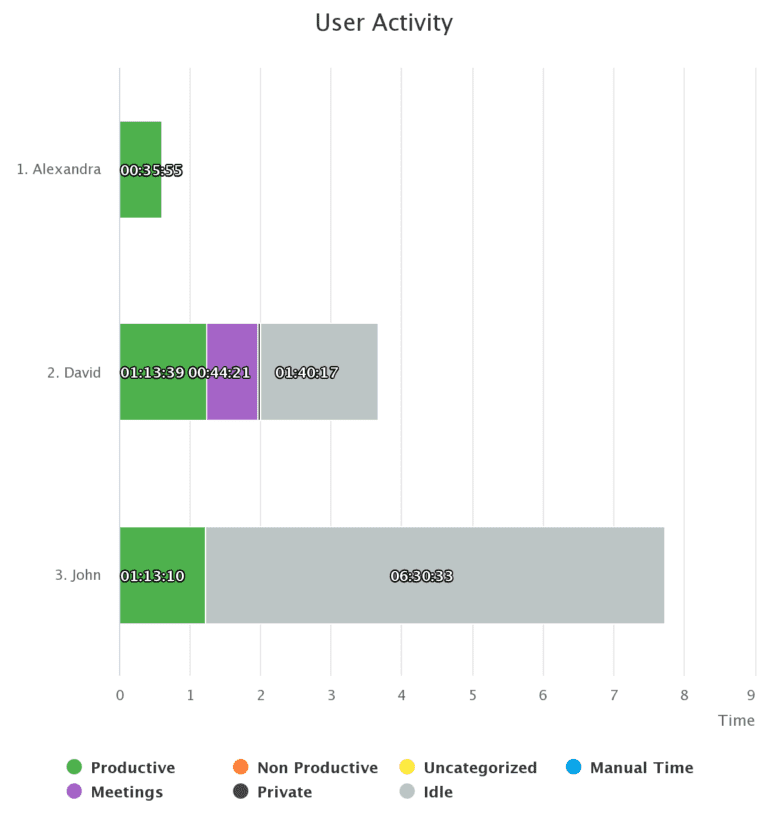
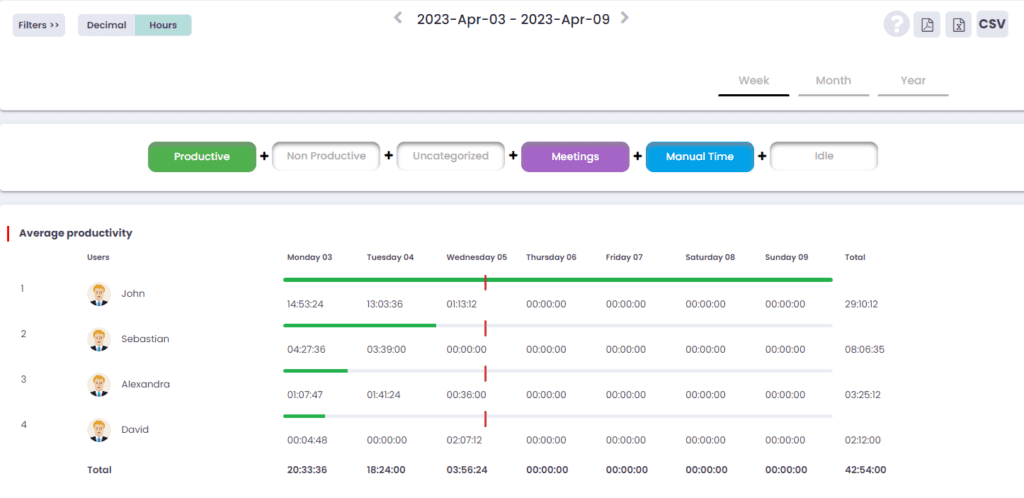
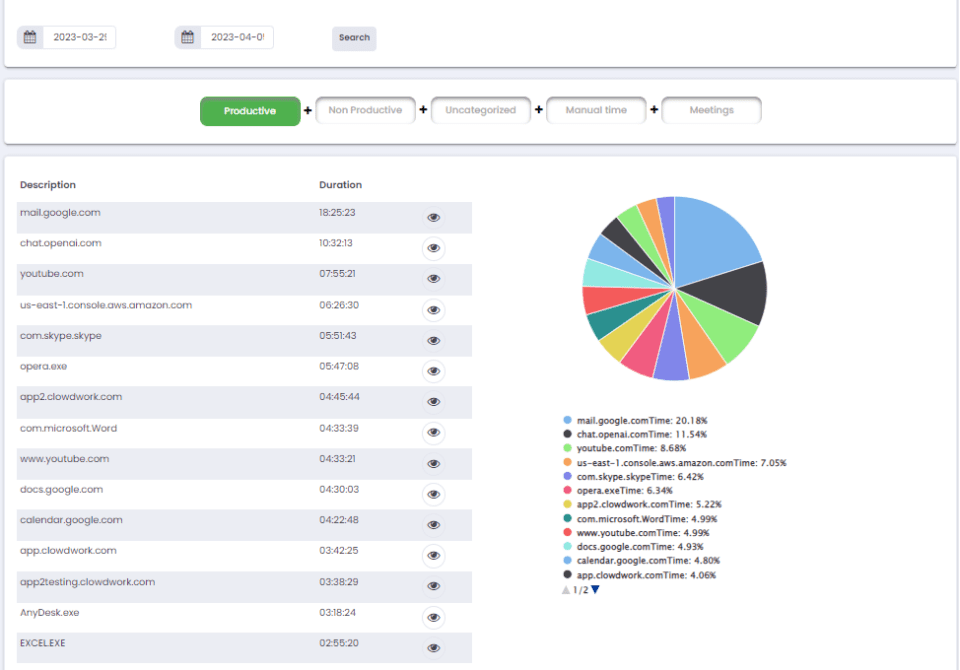
Productivity measures. Intelligence understands.
The data Productivity captures is the foundation on which ClowdWork Intelligence identifies meaningful changes, patterns, and opportunities.